

Introduction
Analytics shows how many requests your silos serve, how that changes over time, and how many requests are rejected. Use it to spot your busiest silos and to notice when clients start failing.Analytics is included in the free trial and on the Basic and Pro plans. See Pricing Plans.
Open Analytics
Click Analytics in the sidebar, under Observe.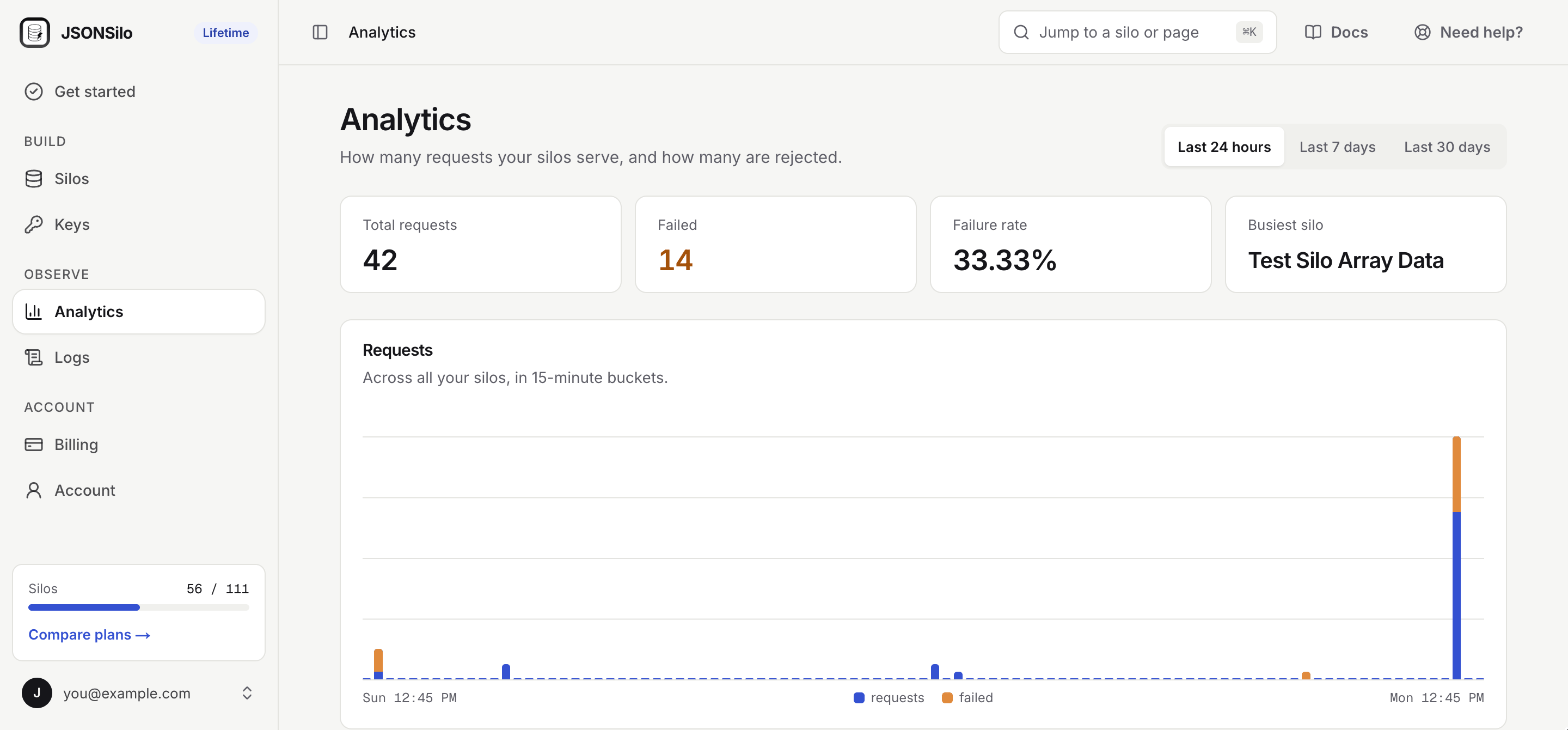
- Totals: Total requests, Failed, Failure rate, and your Busiest silo for the selected range.
- Requests: A chart of requests across all your silos, with failed requests marked.
- By silo: A table of your silos, busiest first, with each one’s share of traffic, requests, and failed requests.
Choose a Range
Use the Range switch at the top right to change the period.
How far back you can look depends on your plan. A range your plan doesn’t include shows a lock.
Analytics for One Silo
Each silo has its own chart. Open a silo and look at the Requests card on the Overview tab. ClickView all analytics to go back to the full screen.
The Silos list also shows each silo’s requests for the last 24 hours, so you can sort the list by Requests.
What Is Counted
A request is counted when it reaches one of your silos:- Reads of a private or public silo URL, including Query and Search.
- Manage API requests.
- MCP tool calls and resource reads.
Notes:
- Counts are sampled at very high volumes, so busy silos show a close estimate.
- Data covers the last three months.
- Analytics started counting when the feature launched, so there is no history from before then.
- Requests are counted on every plan. If you upgrade, your existing history is already there.